Visual Work
Data Visualization.
Turning data into stories.
01 · Aviation Accident Analysis · Python, pandas, matplotlib
I ran an ETL analysis on U.S. civil aviation accidents from 1962 to 2023, looking at aircraft makes, carriers, weather and phase of flight in relation to incidents and fatalities.
It’s a topic I’m genuinely into. I used to watch Air Disasters as a kid, and still do. I looked at fatalities alongside incidents, since most incidents are handled safely and often go unnoticed by the people on board.
- 01
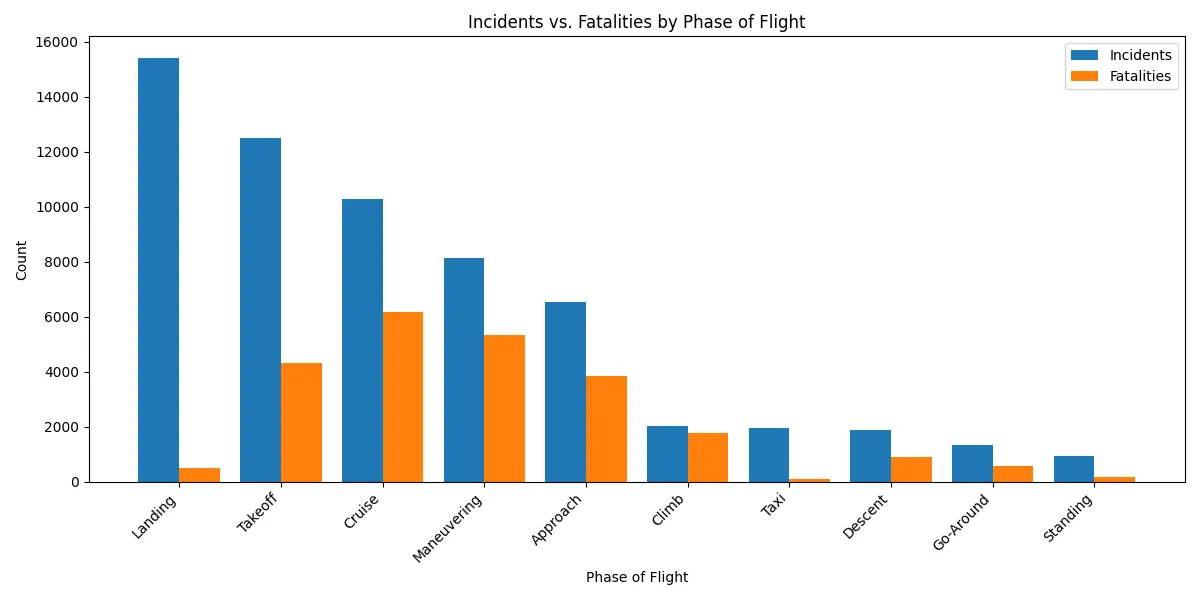
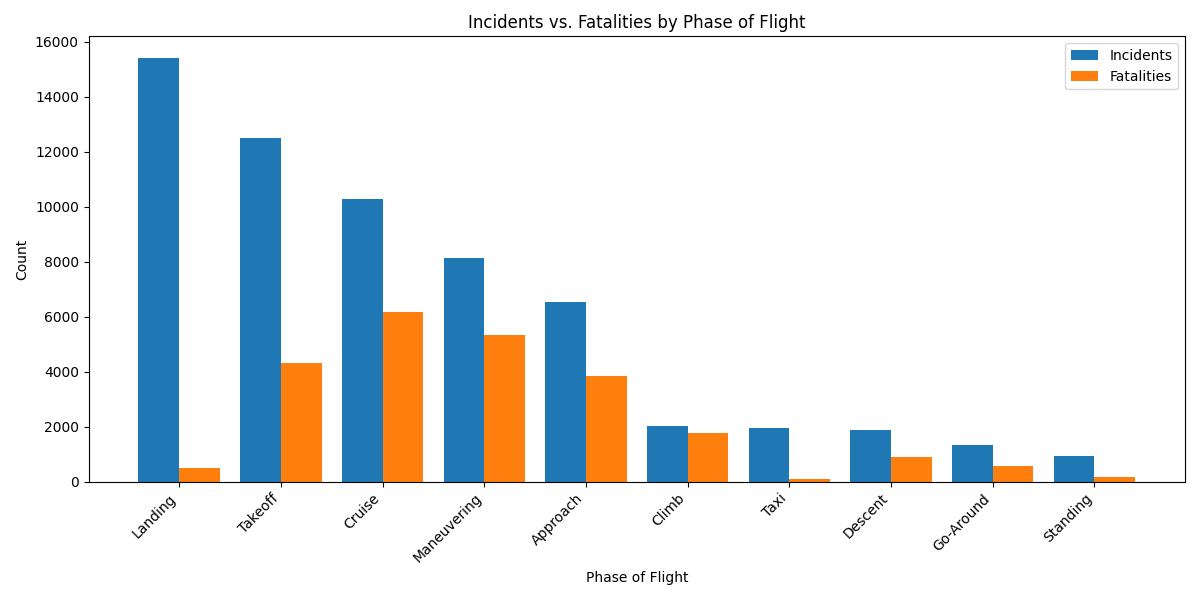
Most incidents happen on landing. The deadliest happen at cruise.
Landing has by far the most incidents, followed by takeoff and cruise, but very few landing incidents are fatal. Cruise and maneuvering are less frequent and far more severe.
- 02
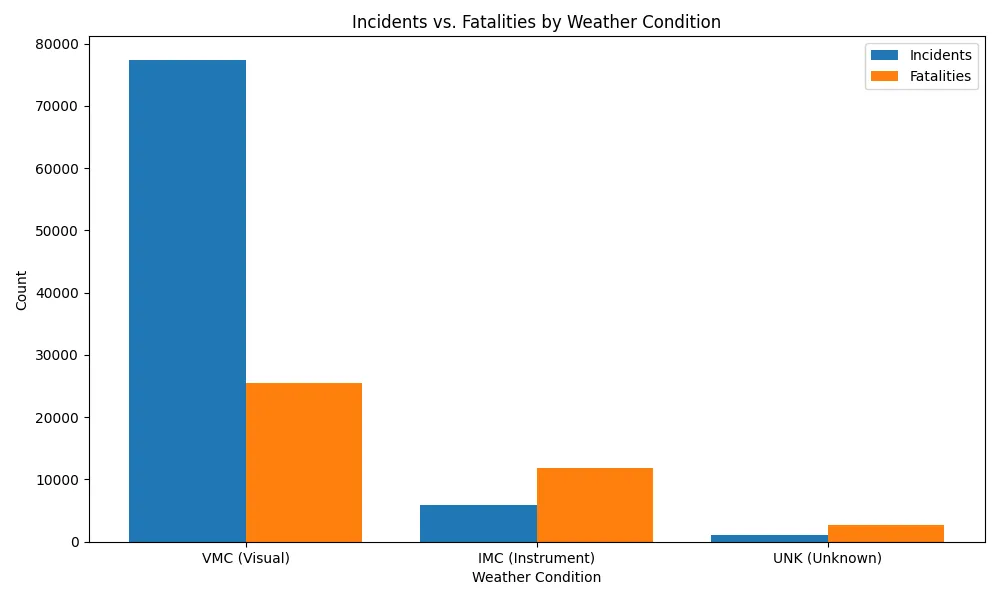
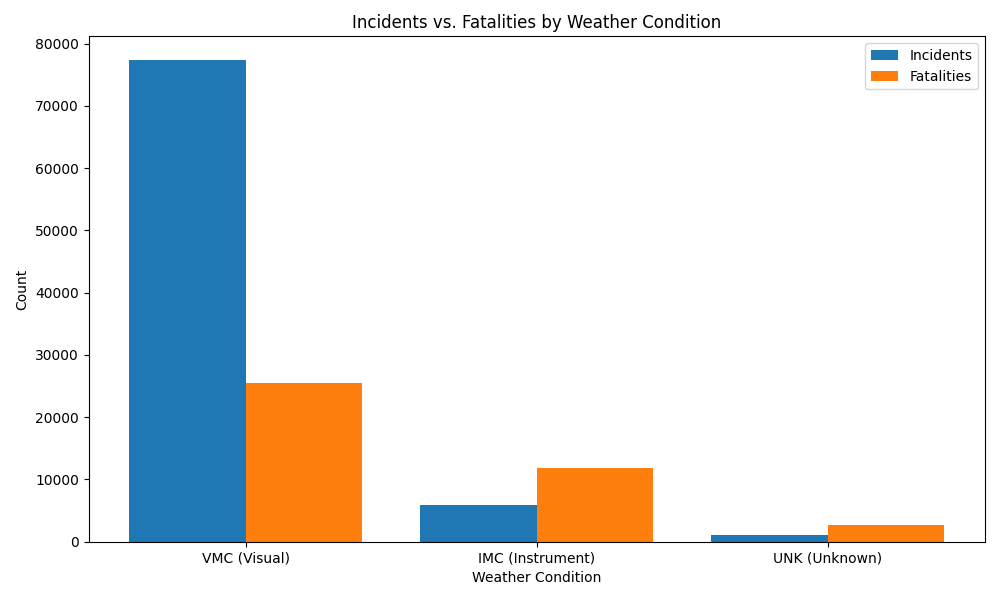
Clear skies see more incidents. Instrument-only flying sees more deaths.
The large majority of incidents happened with normal visibility (VMC). But more fatalities happened with no visibility (IMC), when the plane is flown by instruments alone.
- 03
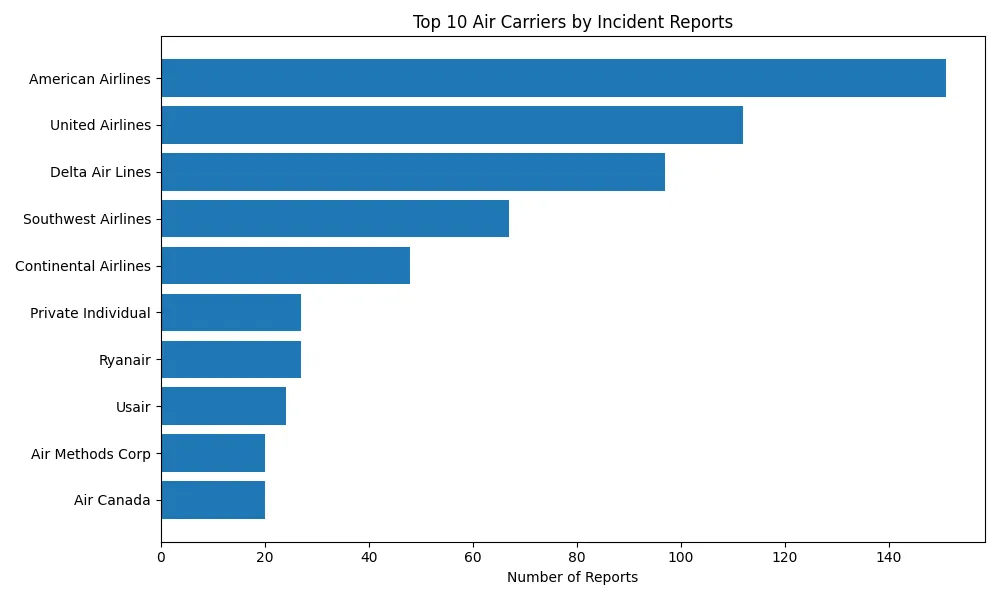
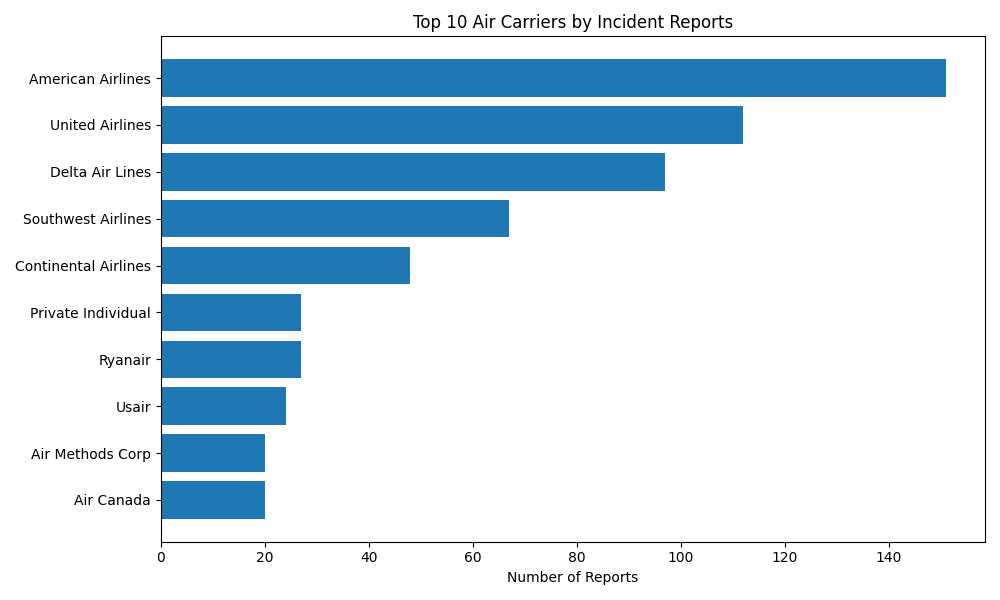
The biggest airlines report the most incidents, likely because they fly the most.
American, United and Delta top the list, which may simply reflect that they have some of the highest flight counts.
- 04
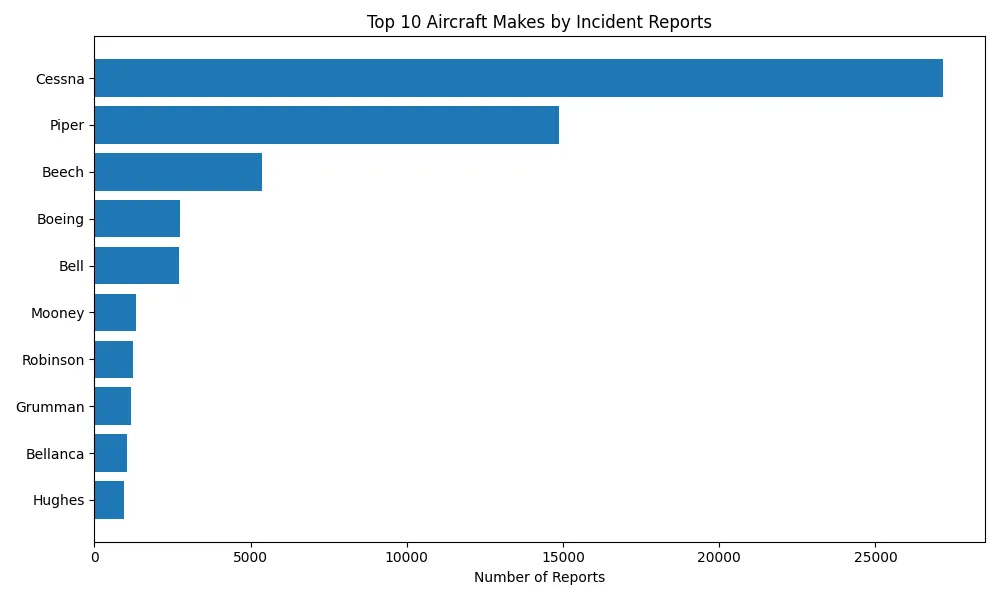
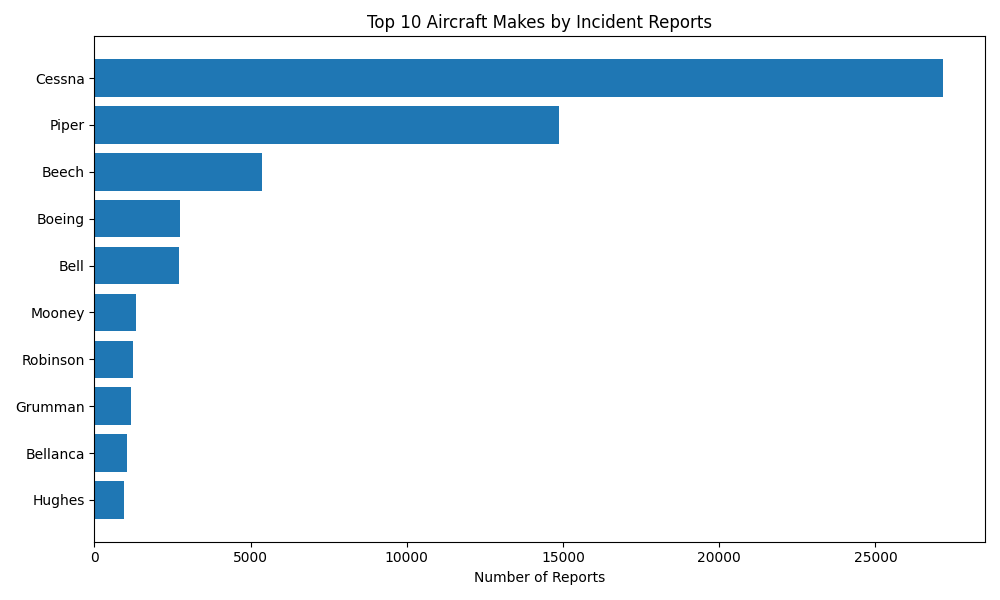
Cessna, Piper and Beech lead in incidents, and they’re mostly small private planes.
All three make smaller, single-engine aircraft often flown by private pilots, which may explain their higher incident counts.
How I built it
A zipped CSV from Kaggle, unpacked and read with pandas.
I unzipped the dataset with Python’s zipfile module and read it into a pandas data frame. The data had special characters, so it needed a specific encoding.
#Unzips the Kaggle file
with zipfile.ZipFile('aviation_data.zip', 'r') as zip_ref:
    zip_ref.extractall('aviation_data_folder')

#Loads the main dataset
full_df = pd.read_csv('aviation_data_folder/AviationData.csv',
                      encoding='ISO-8859-1')
Cleaning names, merging duplicates, and dropping placeholders.
I picked the columns I thought might correlate with incidents or fatalities: make, air carrier, weather and phase of flight.
Inconsistent capitalization created duplicates like AMERICAN AIRLINES and American Airlines, so I normalized case and merged variants by hand. A loop filtered out placeholder entries like “Pilot” and “On File.” Then I grouped and counted each category, mostly keeping the top 10.
air_carrier_df['Air.carrier'] = air_carrier_df['Air.carrier'].str.title()

#Combine duplicate names
air_carrier_df['Air.carrier'] = air_carrier_df['Air.carrier'].replace({
    'Delta Air Lines Inc': 'Delta Air Lines',
    'American Airlines, Inc.': 'American Airlines',
    'United Air Lines Inc': 'United Airlines',
    ...
})

#Loop and conditional to filter out "Pilot" and "On File"
cleaned_air_carriers = []
for carrier in air_carrier_df['Air.carrier']:
    if carrier != 'Pilot' and carrier != 'On File':
        cleaned_air_carriers.append(carrier)
Four charts in matplotlib, two of them comparing incidents to fatalities.
Two ranked bar charts (makes and carriers), and two grouped bar charts that put incidents and fatalities side by side, for weather and for phase of flight.
Challenge
I started with the NTSB’s own database, but its .mdb format needed an extra driver to extract, so I switched to Kaggle’s CSV version.
x = np.arange(len(combined_phase['Flight_Phase']))
width = 0.4
plt.figure(figsize=(12, 6))
plt.bar(x - width/2, combined_phase['Total_Reports'], width=width, label='Incidents')
plt.bar(x + width/2, combined_phase['Total_Fatalities'], width=width, label='Fatalities')
plt.xticks(ticks=x, labels=combined_phase['Flight_Phase'], rotation=45, ha='right')
plt.title('Incidents vs. Fatalities by Phase of Flight')
plt.legend()
plt.show()02 · Aviation Datastory · Tableau
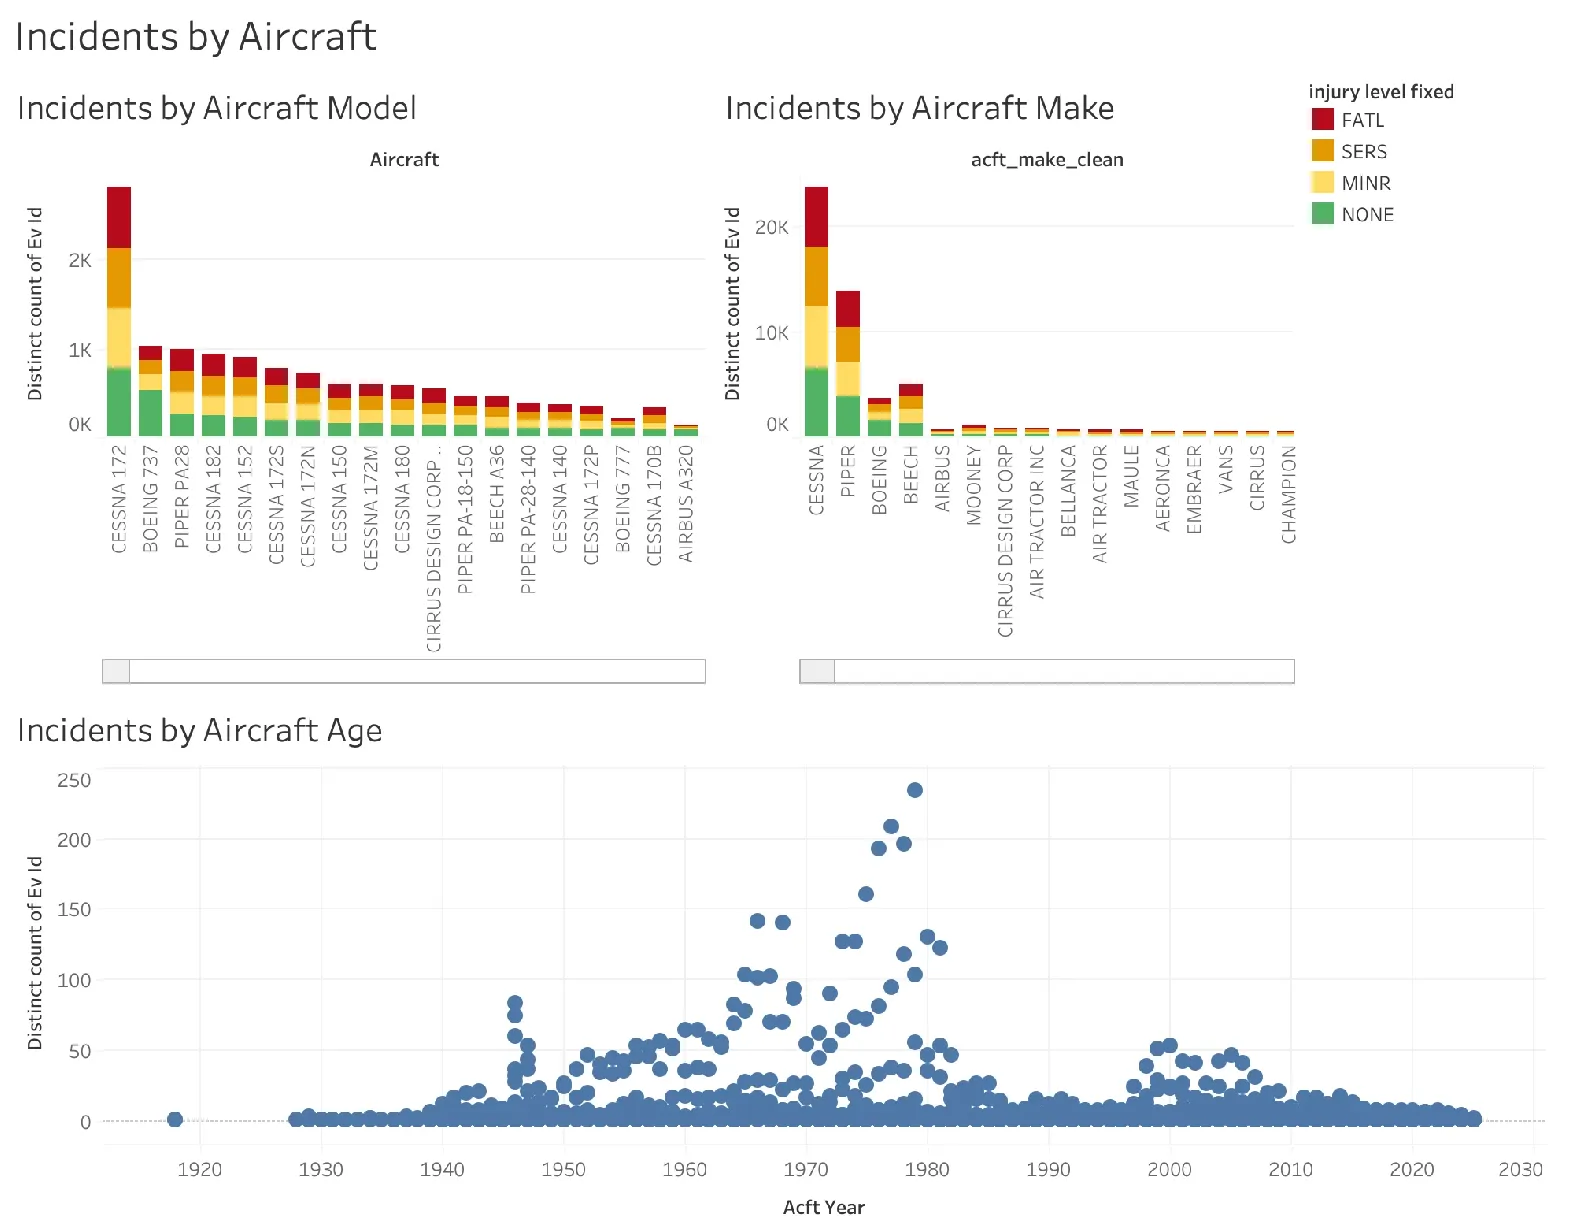
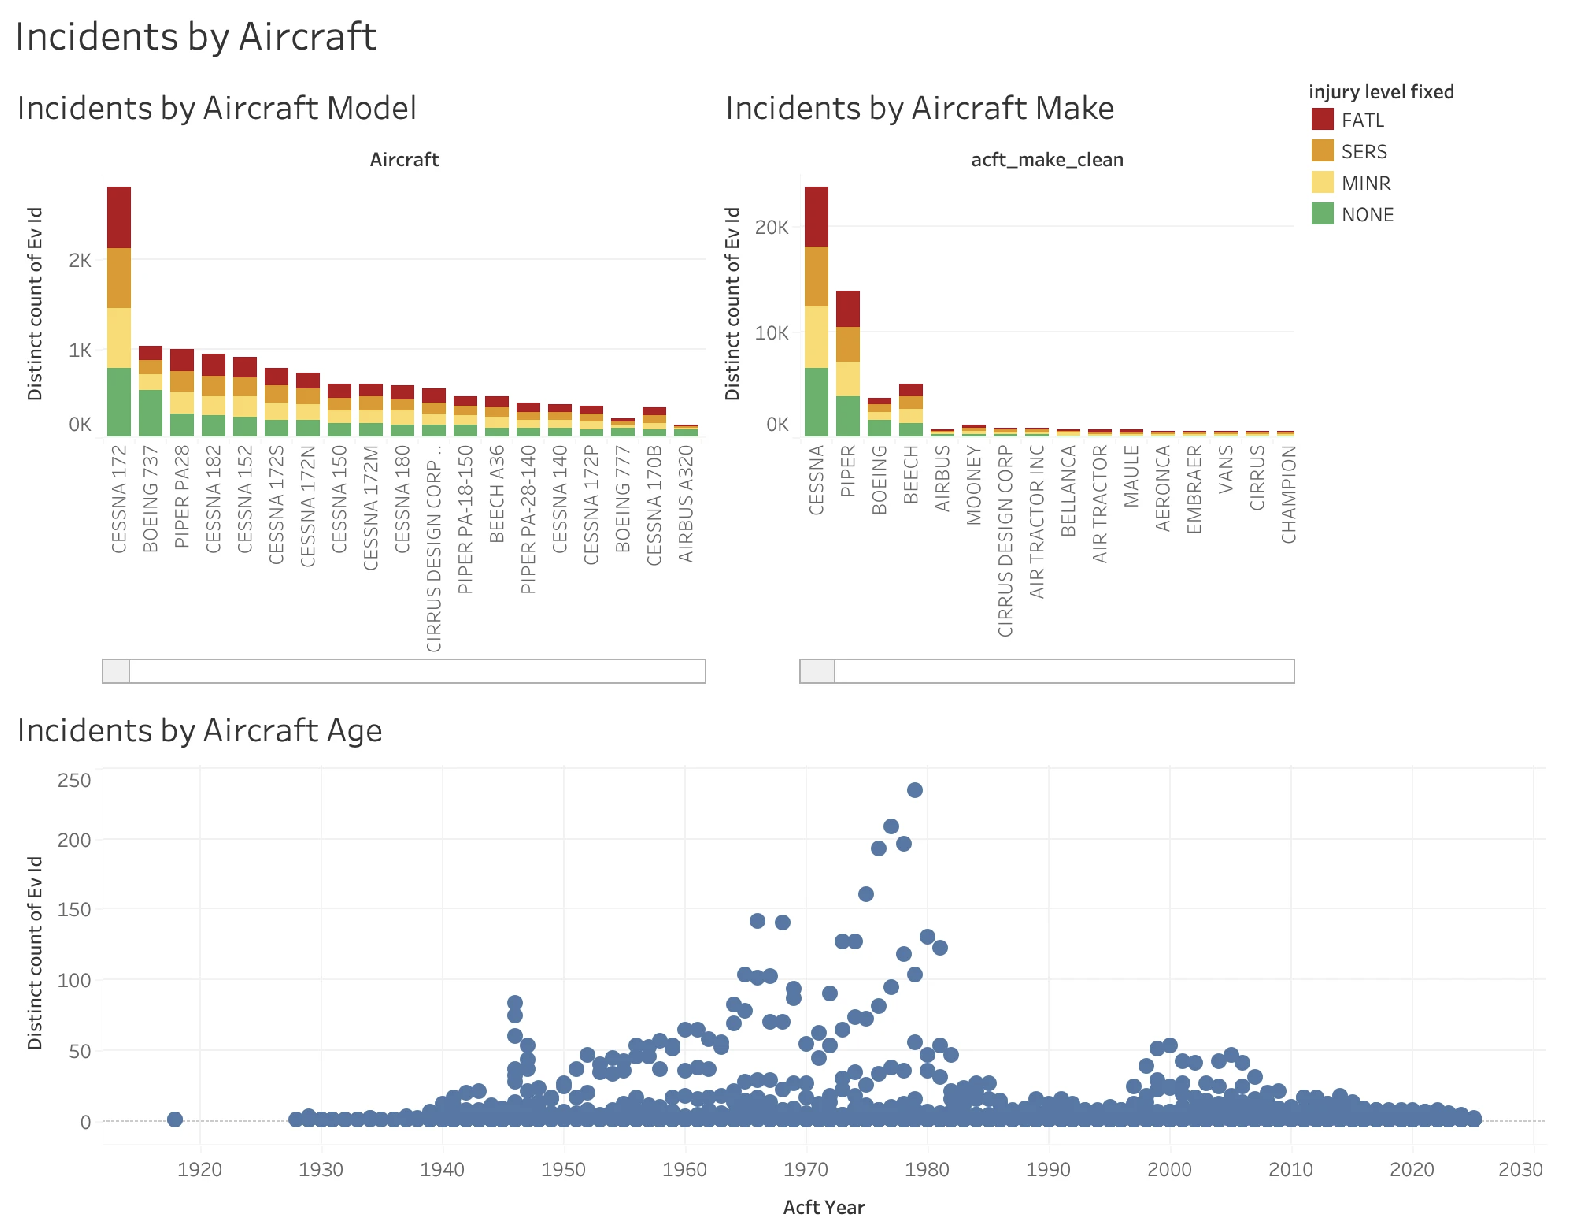
Incidents by aircraft.
Incidents by aircraft model and make, stacked by injury severity, and plotted by the aircraft’s year.
03 · Infographic · Figma · 2024
The Fatal Journey.
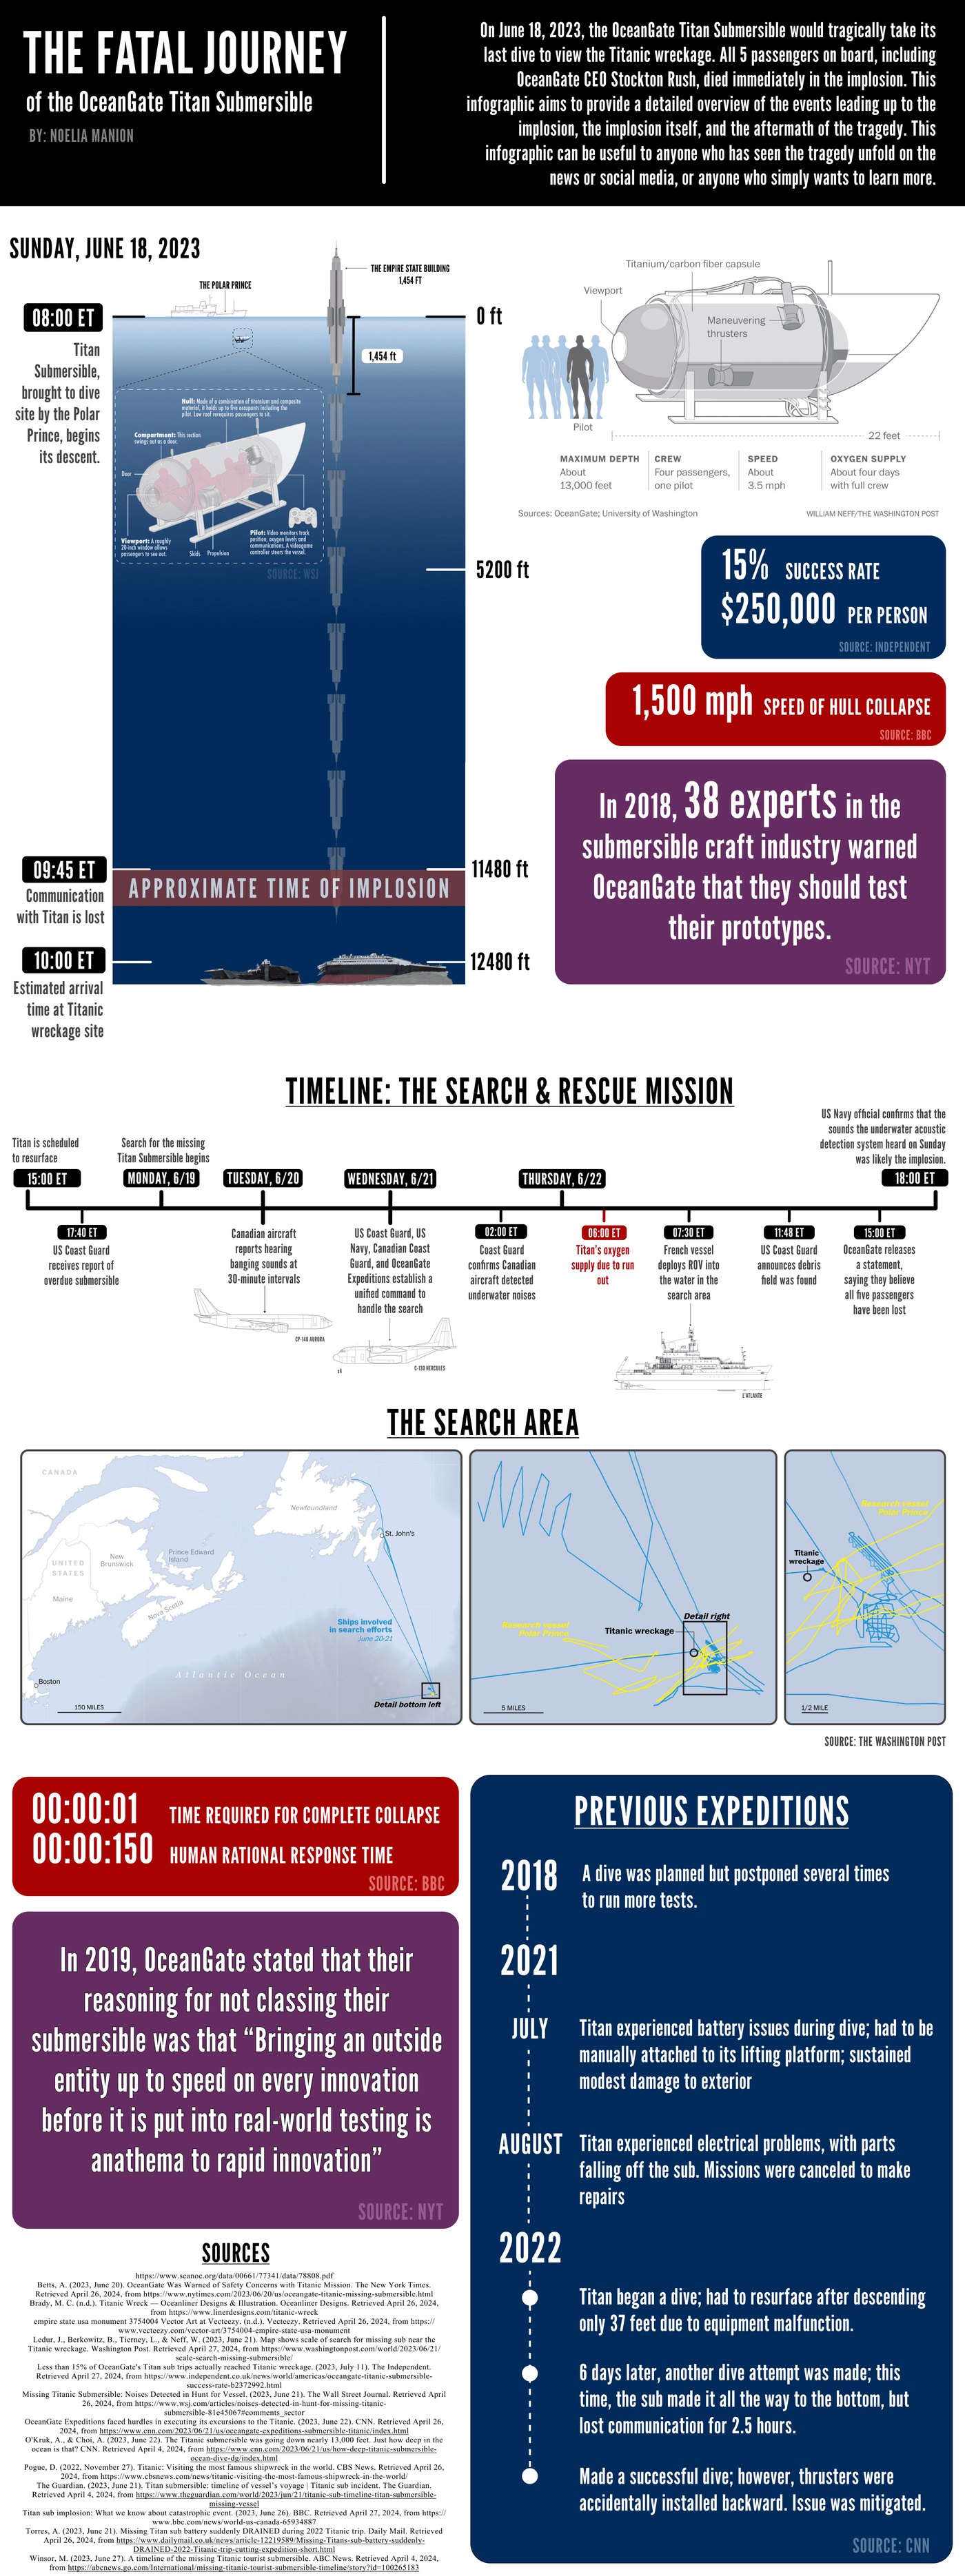
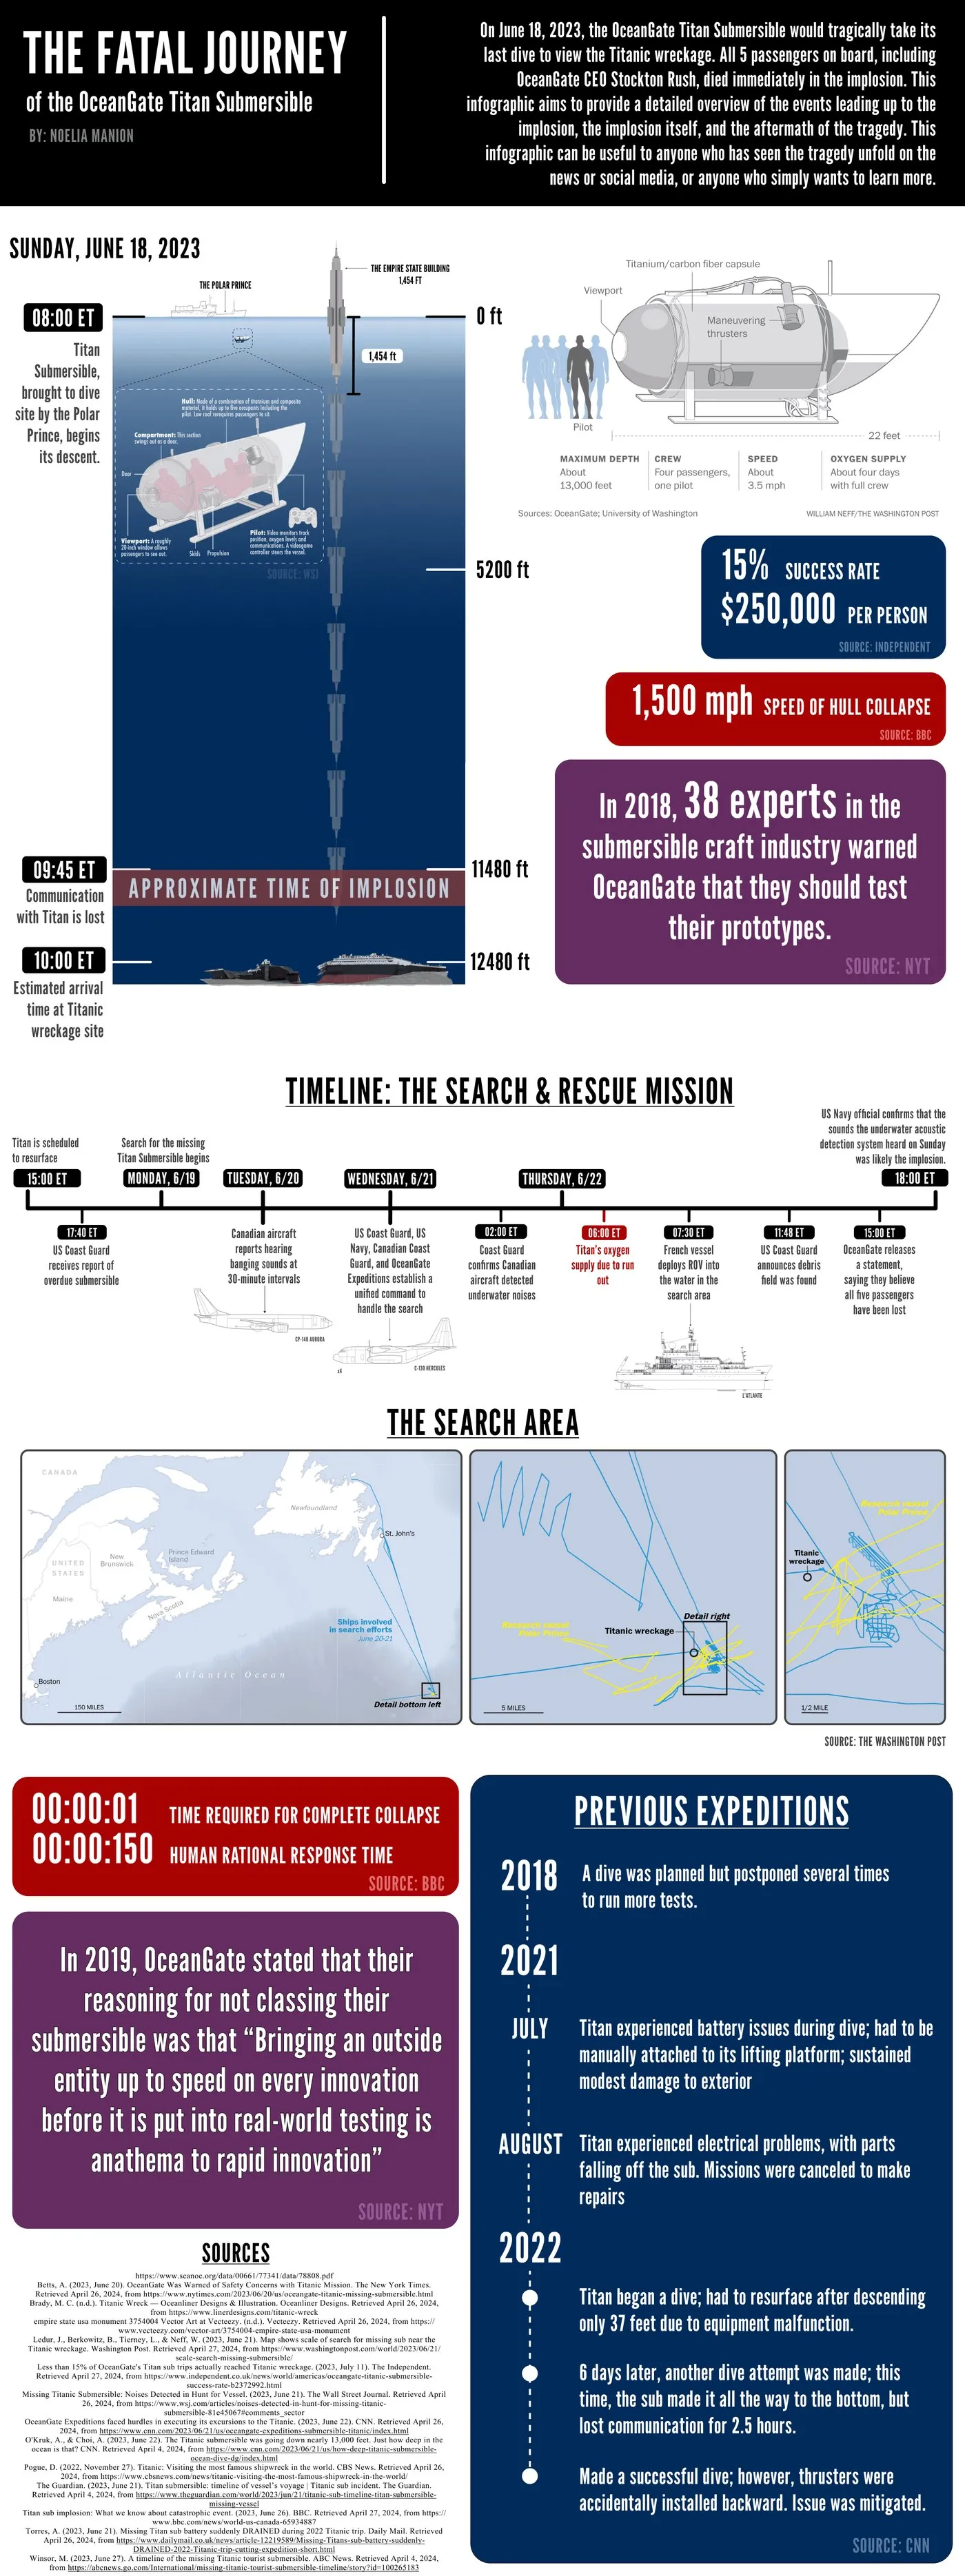
On June 18, 2023, the OceanGate Titan submersible imploded on its way to the Titanic wreck. This infographic walks through the events leading up to it, the implosion itself, and the search that followed, for anyone who watched it unfold on the news and wanted the full picture.
- A timeline of the dive, minute by minute
- The search, day by day, with maps
- The warnings and earlier expeditions
- Every figure sourced, from the BBC to the NYT
Scroll inside the window to read it. Click to enlarge.